
My parents (God rest their souls) always were helpful with our 4 kids and money for college. When Addison and Emerson were born, they started a 529 savings account for each child and contributed $100 every month. When the girls were two years old I matched that by contributing an additional $101 every month. We continued that until my parents moved in 2022. So, we averaged about $201 in every month, or about $2,500 in each year for ~15 years. I took out ~$20,000 from each account from 2018-2024 for my graduate school and Evan’s schooling. So how much has that ~$13,000 in principle grown to now they are both 18 and heading out for college next Fall?
Well, when Addison and Emerson were still preschoolers I decided I would run an 18 year experiment. I would invest all Addison’s account in an SP500 fund, and Emerson’s I would invest 50% in SP500 fund and 50% in the age based fund, the kind that are more aggressive when the kid is younger, and more conservative as the kid nears college.
Of course this was not to favor or handicap one child — as the account owner I can always shift money, so the expectation is mom and dad will pay for college – I was never intending to give Addison the ability to go to only to OCCC and Emerson to Vanderbilt if the market did bad, or the reverse if the market did good.
So, looking behind the covers, the fund the Oklahoma college savings plan (the only one I get a state tax deduction for) — now calls the “U.S. Equity Index Option”, which when you go to their page https://www.oklahoma529.com/investment/risk-based/us-equity-index-option/ says it is really 100% invested into symbol TIEIX – Nuveen Equity Index Fund. The benchmark for that fund is the Russell 3000 Index. I know the Russell 5000, but Russell 3000? Never heard of it. So how has that fund done compared to SPY? Well, pretty similar. Both market cap weighted indexes, just the SP500 is limited to the top 500, Russell3000 is 3,000. The top stock weighting of the SP500 is NVDA at 7.96%, where the top of the R3000 is also NVDA at 6.78%.
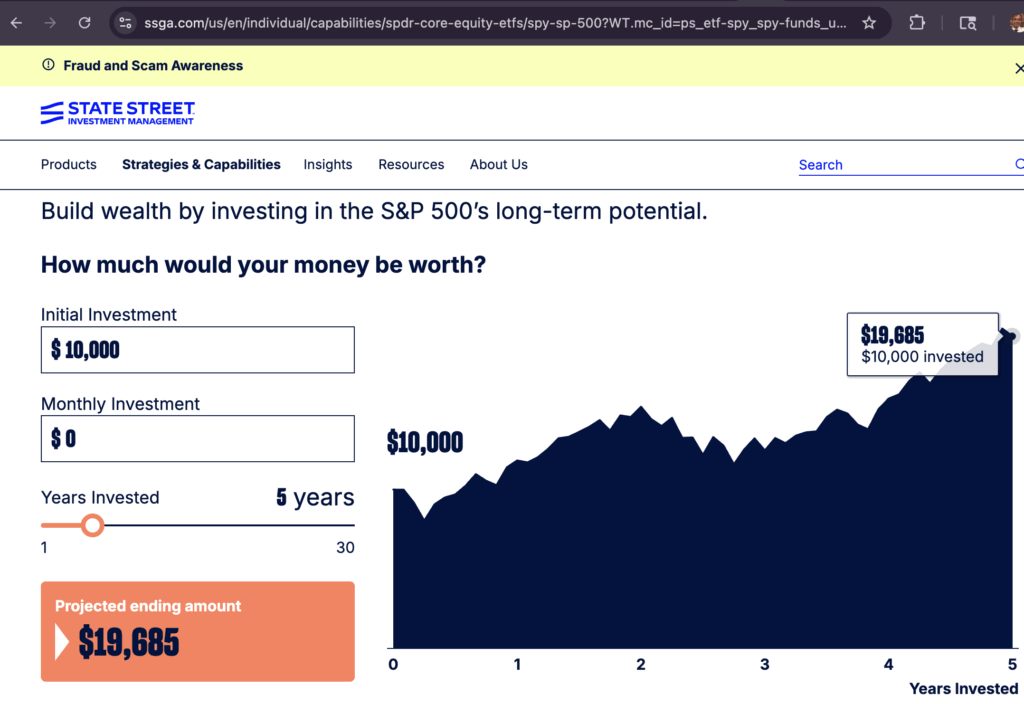
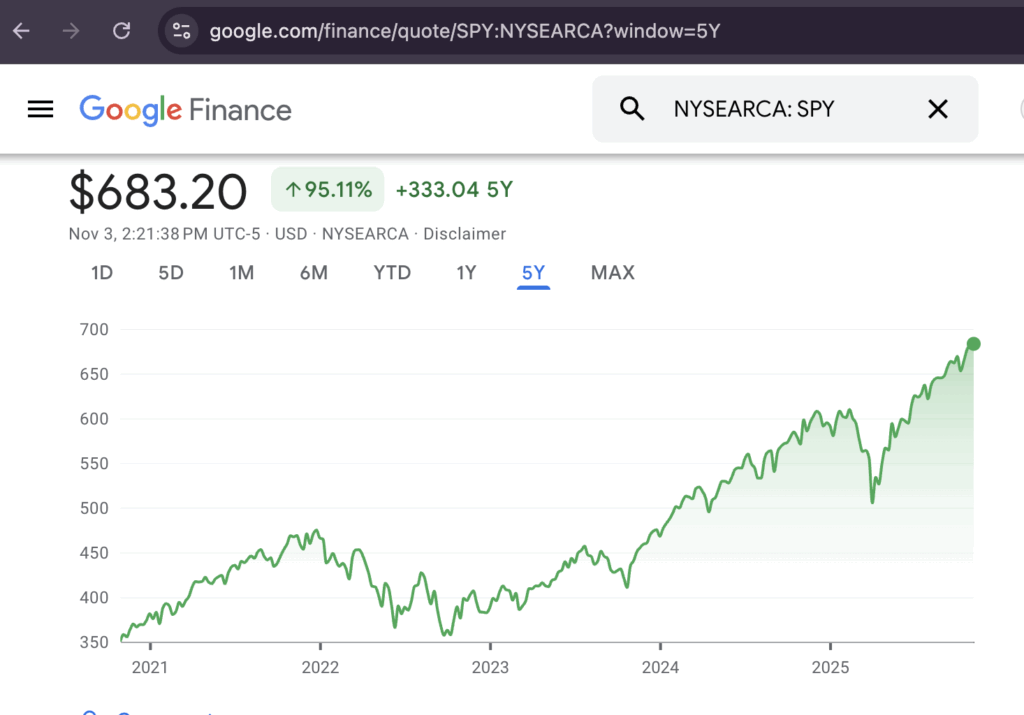
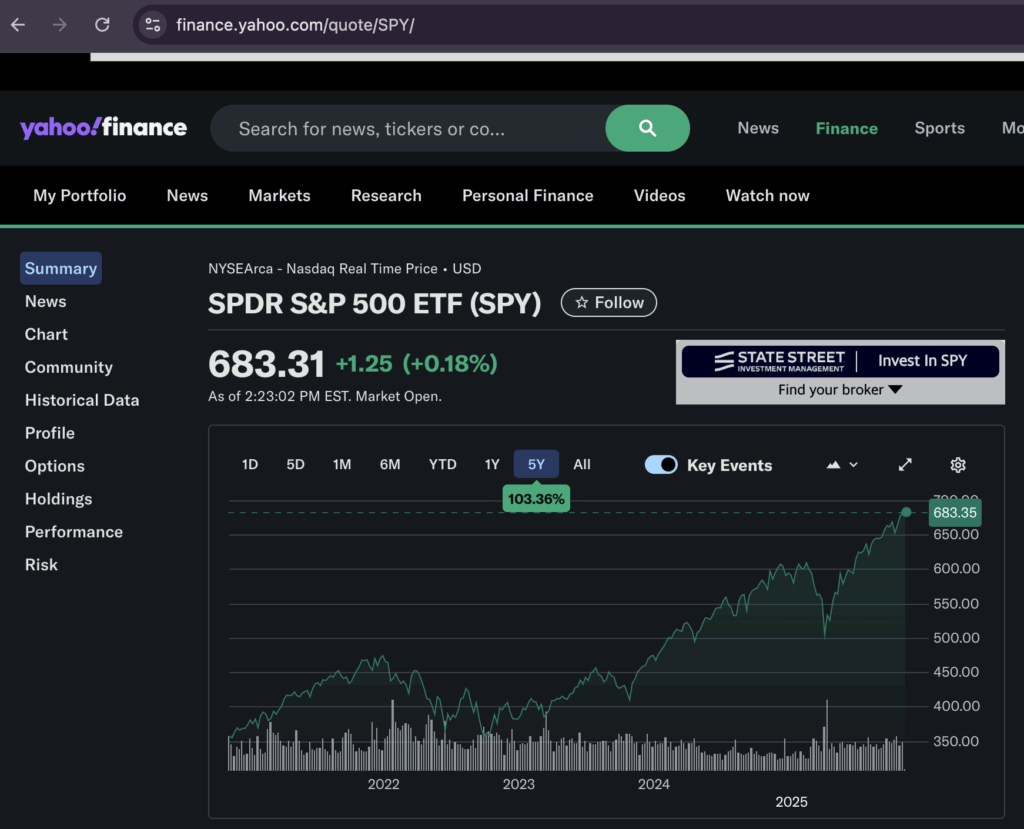
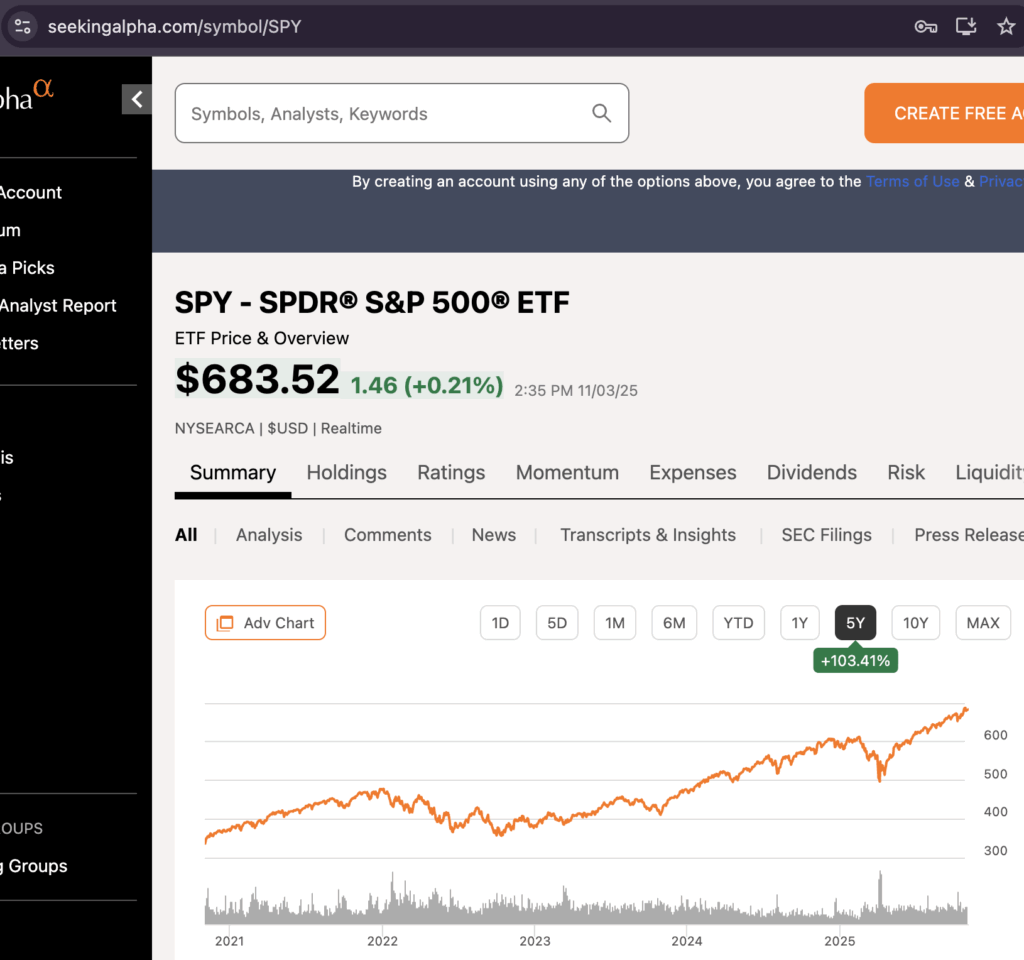
To get performance, however, you must cite your source of truth. Even something straightforward like SPY, well look at these different reported results for 5 year SPY performance. Let’s look at State Street (the funds owner), Google finance, yahoo finance, and SeekingAlpha for $10k invested 5 years ago:
| State Street | $19,685 | |
| Google Finance | $19,513 | |
| Yahoo Finance (chart) | $20,336 | |
| Seeking Alpha | $20,341 |
so why the difference? Dividends? let’s use yahoo finance daily historicals:
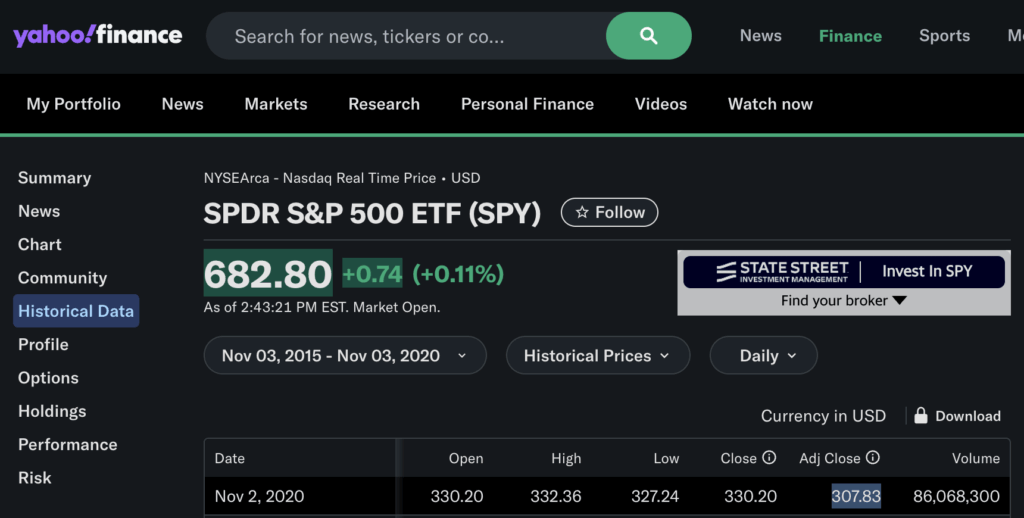
adjusted close of 307.83 to today’s price of 682.80 is 121.96% or $10k invested is now $22,196. So no, dividends were not even included. The non adjusted price of 330.20 to todays 682.80 is 106.9% or $10k is 20,692. Here is the updated chart:
| Source of Truth | current value of $10k invested in SPY 5 years ago | |
| State Street | $19,685 | |
| Google Finance | $19,513 | |
| Yahoo Finance (chart) | $20,336 | |
| Seeking Alpha | $20,341 | |
| Yahoo Finance (historical, adjusted close) | $22,196 | |
| Yahoo Finance (historical, actual close) | $20,692 |
This is a kinda big deal. The difference from $22,196 to $19,513 is 14%. Heck, without dividends, the difference from $20,692 to $19,513 is still 6%. 6% is two years on a cash account.
OK, set aside for the moment that management fees suck and the industry feeds off you like mosquitos feed off water buffalo. I guess we just accept it.
Back to the initial question — how did the 2 portfolios do? Well, here are the values today (Nov 3, 2025).
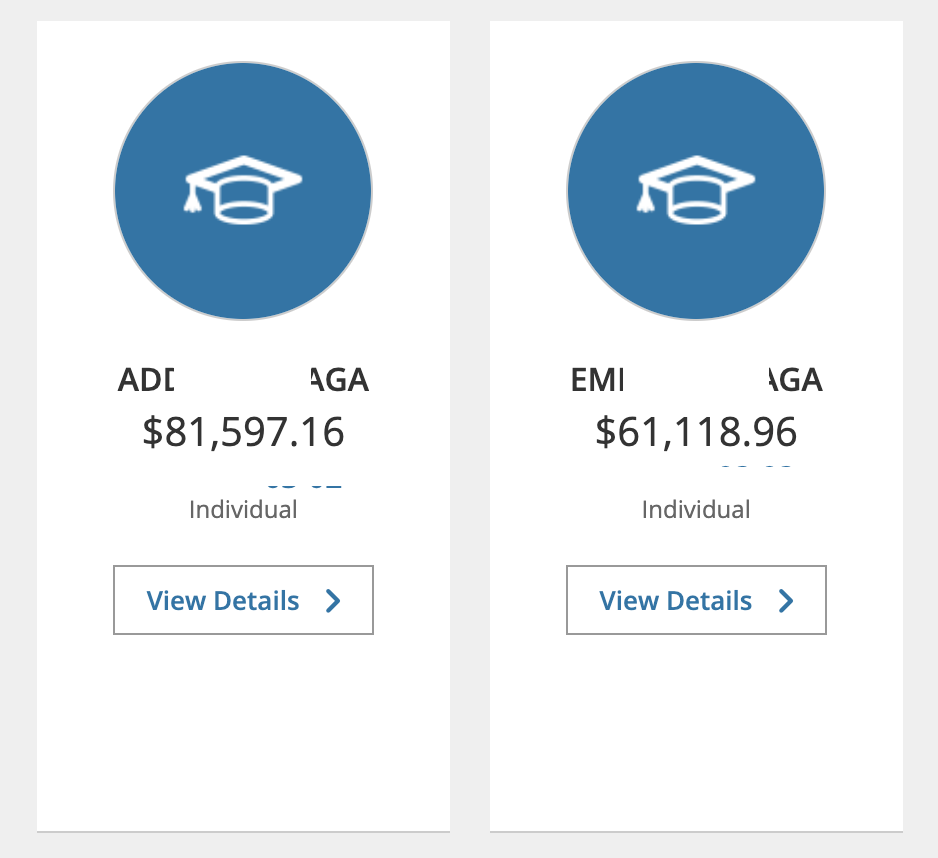
So $20k more, just by choosing full SP500 over 50/50 SP500/Age fund. Heck if I had just chose age fund for both, it would only be $40k each, not even enough to fund 1.5 years of school.
So now let’s look closer — I chose the Oklahoma fund and the investement choices they provide — but what if I owned my own? Let’s look at several scenarios:
- US Equity Fund, from OK4Savings.org
- 2024/2025 Enrollment Option, also from OK4Savings.org
- TIEIX
- SPY
- QQQ
- TQQQ
- 1) As a baseline, here are the contributions to Addison’s account and total value now:
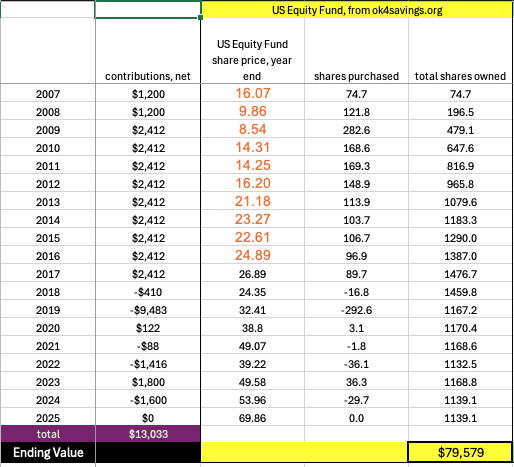
$13k net principle becomes $80k now. Good, not great.
2) OK, some will say I was “too aggressive” with 100% US Equity Index, and I should have done the 2024/2025 Enrollment option. Look here:
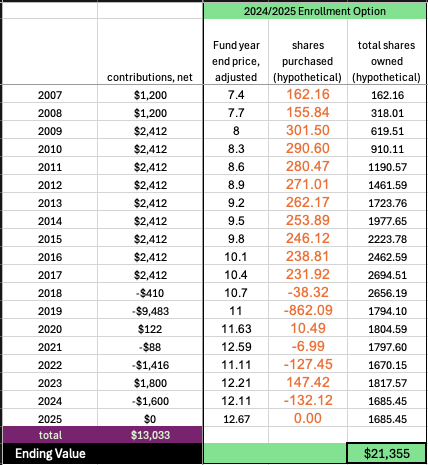
Would take $13k to $21k. Awful. Note, there were a lot of band rolls as she got older and automatic switching of funds prior to 2020. That’s why the year end prices look so rigid, but this is directionally correct.
Lesson 1 — Screw the people who tell you to invest concurrent with the kids age. It is just plain bad advice.
I know that the market is at all time highs now so it is easy to draw up lesson #1, but I strongly feel it is the correct lesson. If the market tumbles anyways then schools tuition and fees would go down commensurate. Don’t spend your life (and investments) worrying. It will kill you in the end, just like the unworthy servant who hid his talent in the ground. After all, that servant did safeguard and return the masters talent in perfect condition. What did it get him? He got called “wicked and slothful” by Jesus himself. Do you really want God to look at you and call you wicked or slothful? If not, heed lesson 1.
3) OK, now what if instead of TIAA/CREF, I just opened a Schwab account and invested in TIEIX directly?
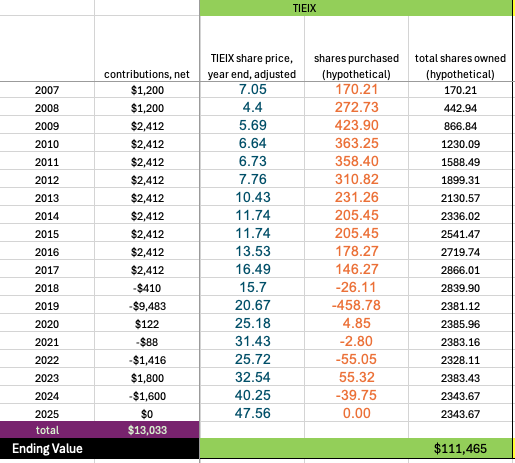
Wow, that is a hell of a difference. $110k instead of $80k. Sure, you don’t get the state tax deduction, but that was not worth $30k. Again, financial management fees suck and the industry feeds off you like mosquitos feed off water buffalo.
4) OK, what if I invested in SPY instead of TIEIX in that Schwab account:
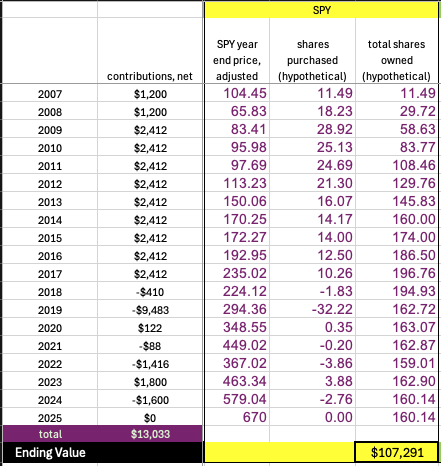
Basically the same as TIEIX, actually $5k worse. But basically the same.
5) Let’s get riskier: How about QQQ? The girls were born and this fund what set up the same time the iPhone 1 came out. Betting on tech (of course hindsight is 20/20) would have been a good thing:
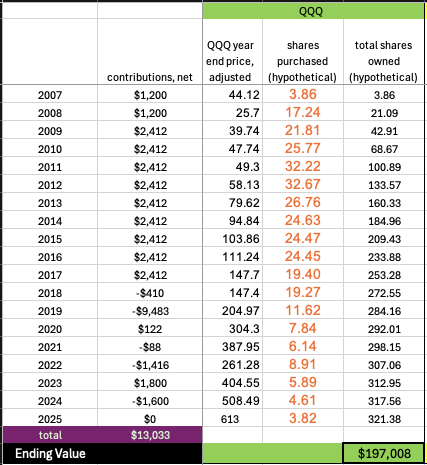
Wow – $13k becomes $200k. Now you are talking. College is fully funded and mom and dad don’t have to dip into savings.
Lesson 2 — Invest risky, and keep the investment on no matter what (COVID, etc)
If you have belief in the future of the US, Lesson 2 is the only lesson you need to remember. As long as we are 4% of the world but 33% of the world’s economy, the reserve currency of the world, the strongest military in the world, etc — bet on the US for the very long term. We have a US exceptionalism and optimism that does not exist in other countries. Hell, in western Europe they are damn apologists. No one want to buy into that thinking.
6) OK, Final risk up trade, right up there with putting it in bitcoin. How about if I did TQQQ (leveraged ETF). The fund did not exist until 2010, so just take the principle inflows from 2007-2009 and dump it in the trash can. What do we get?
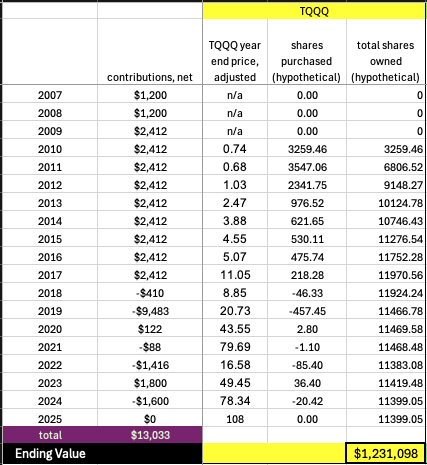
That’s right $1.2 million! And not going from $13k to $1.2 million, more like $8k to $1.2 million, because this starts in 2010. Now we are talking!
In truth, I don’t think there is any way I would have been able to keep this level of risk tolerance on. There is no way I would not sell during COIVD or any other number of days (like even today, just a 1% down day). But if I had – wow — I wish I had is all I can say.
Lesson 3 — all the savings, all the austerity – delay that purchase, get the cheaper model, it may all be worthless noise. Just click a few correct buttons a few times in your life >> all else.
Lesson 3 is kind of depressing, actually, but real and true. Sure, I wish I had twenty bitcoin lying around — I set up my first bitcoin full node when each coin was $100. Coulda / Woulda / Shoulda. My dad used to tell me he should have bought Boeing in the 70s and he would be passing $10 million to me. He didn’t and I didn’t. Oh well, I loved my dad very much, and that was worth a lot more than $10 million, and I am being very honest about it.
Still though, my hope is people reading this will have both — ample funds for all your dreams, and long and healthy lives with family. Thanks for reading!


