Category Archives: playoffPredictor.com

Final CFB playoff predictions 2023

The games have been played up to conference championship weekend. The committee has spoken 5 times. On Sunday they speak for a 6th and final time for this 4-team format. The computer has churned out the answers — and the model likes Ohio State and not Alabama or Texas if one or more teams slip up this weekend.

I don’t like it, but the committee has over-liked Ohio State all these weeks, putting them at #1 when the model has them usually #3 or #4. Even last week after the UM defeat they only went to #6 and the computer has them at #5, so small negative bias, not enough to make up for weeks 1-4.

Right now the only path for Texas is Washington and Georgia winning, Michigan and FSU losing (about a 0.2% chance). The only path for Bama is Washington winning, Michigan and FSU losing (about 0.4% chance)

If the committee ends up agreeing with the computer I’ll be happy the committee did the right thing, but mad at the committee for being wrong weeks 1-5. Let’s see what happens. https://playoffpredictor.com

Betting on the CFB 2023 season

I am going to use my model and track prediction accuracy for beating Vegas for 2023. Picks will be tracked at predictions.collegefootballdata.com. 2 accounts will be used to track the model:

  • @PlPredict_all for all FBS games, and
  • @playoffPredict for high-confidence games per the model, additionally
  • @cfb_vegas_line for the Tuesday (opening Vegas line)

Definition of high confidence is >= 7.5 points difference between Vegas line and computer model. Only applies after week 2 (weeks 3 till end of season)

Model will not be updated within a week (picks locked on Tuesday)

u/nevilleaga is going to pick all games using the trailing 15 weeks of data (meaning if it is week3 using week 1-2 data from 2023 and using week 3-17 data from 2022

use @CiscoNeville to mess with any personal ideas. One example is looking at the line and predicting something close to the line skewed by the method. @CiscoNeville will do that by using actual 2023 game results plus one extra week of the line as results. So for example if the OU-Iowa State line is OU – 14, a game will be entered with OU 14 IowaSt 0 like it actually happened.

Results published here as comments

update 9/28/23 – I realize that for weeks 2-4 I used and m of best for eta, not m of best against the spread. For week 5 and forward I will be using m=ATS model 6, which goes from m=-0.8 for a 1 point 1 to m=+0.5 for a 35+ point win.

Best college football team of the cfp era

Now that I have settled on a mathematical model for my playoffPredictor.com computer ratings for the 2023 season, I wanted to look back and see what team has been the highest rated team since my website and the playoff started in 2014.

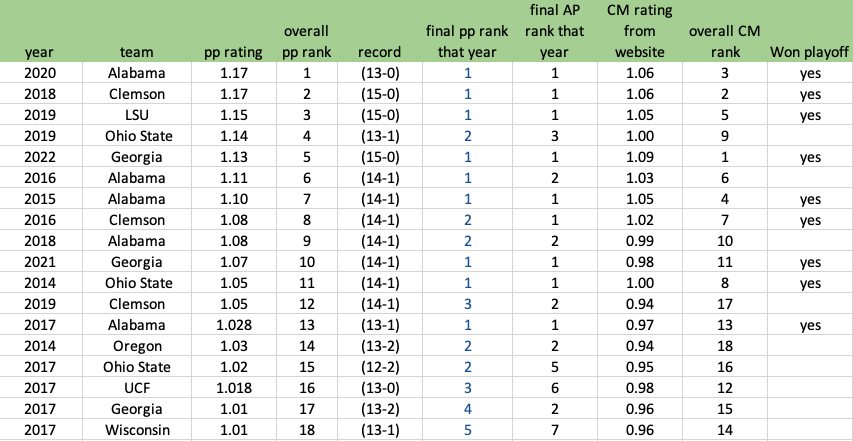
In the 9 years of the cfp era, there have only been 4 teams to go undefeated. There are three 15-0 teams (2018 Clemson, 2019 LSU, and 2022 Georgia), and one 13-0 team as a result of the COVID year (2020 Alabama).

Popular wisdom would tell you that the 2019 LSU team is the best of the last nine years, but put it in the computer and it spits out a surprising result – that LSU team is only 3rd best.

The #1 team of the era? 2020 Alabama. Here is the full list of every team in the playoff era that managed to get greater than a 1.0 playoffPredictor.com rating:

2020 Alabama was an incredible team that does not get their due because of COIVD. No close games at all – closest win was 15-points to Ole Miss. 8 blowouts, including both playoff games. Did not even play anyone ranked lower than #82.

2018 Clemson is on top of 2019 LSU because they played only 2 close games (Texas A&M and Syracuse), only 2 games with a normal victory margin (South Carolina and Boston College, 20-21 points each, which is right on the edge of blowout), and every other game was a >= 28-point blowout, including against #3 Notre Dame and #2 Alabama. I mean, who in the cfp era beats Alabama by 28 points? That list has one entry on it. I mean, there are only 2 other entries on the list that have beaten Bama by more than 7 points in the 9 years of the CFP era (2021 Georgia-15 points, and 2017 Auburn-12 points).

The only teams to make the list outside of the Alabama/Georgia/LSU/Clemson/Ohio State leadership are Oregon, UCF, and Wisconsin.

So back to 2019 LSU, why are they relatively low? Because before blowing out Oklahoma and beating Clemson in the playoff, they played 3 games all decided by 7 points or less (Texas, Auburn, Alabama). That lack of margin-of-victory hurts their overall resume. In fairness, this is a clear situation where Margin-of-Victory does not tell the correct story. In all three of those games LSU was in control and simply recovered an on-side kick by the opposition in order to turn a late 2-score game into a 1 score game and took knees to end those games. Maybe in another year I’ll switch the formula to time of victory and that will put 2019 LSU higher, but that is for another blog post. 2019 Ohio State was an incredible computer team that year, even with the single loss to Clemson. Better than 6 of the last 9 national champions. It would have been something special to see that 2019 Ohio State team take on 2019 LSU if that wide receiver had not stopped his route short.

Playoff probabilities via Monte-Carlo

I have added a product to the playoffPredictor.com site that visualizes the percentage chances a team has to make the college football playoff.

PlayoffPredictor.com was launched with the express belief that if you knew who was going to win future games, you could accurately predict the top 4 in the final poll. If you know (or can predict) that Alabama is going to beat Georgia in the SEC championship game, can you definitively predict if Georgia will still make the college football playoff? Yes, you can answer that if you know how all the other games pan out (like Baylor beating Oklahoma State for example, leaving that slot open for Georgia).

The next logical place to use that data would be to iterate through each future scheduled game and using the probabilities of each team to win, exhaustively calculating the probability of each team to win the college football playoff. Unfortunately exhaustive scenario modeling is virtual computational impossibility. If you tried to enumerate every possibility (just for wins and losses, not even for margin of victory) from week 8 till week 14, you have about ~450 games to model. Given that a game only has two possibilities for the winner, this works out to 2450 = 2.9*10135 scenarios to model. How big is 10 raised to the 135? Well, I have seen estimates of the number of atoms in the know universe anywhere from 1085 – 10110 , so 10135 is many orders of magnitude larger than the number of atoms in the universe, and would take trillions of years to compute.

So do we give up modeling future probabilities? No, we introduce Monte-Carlo simulations. The idea is that if we know percentage chances for an individual trial (say Ohio State beats Penn State 85% of the time), we simulate that trial and the other 449 games a large number of times, and calculate who actually made the top 4. This is much simpler because you only have to compute 450 * 1,000 = 450,000 = 4.5 * 105 computations, and that can be done in a matter of minutes.

So, the new product is on playoffPredictor.com. After week 6 I like how my calculated data matches with reasonable expectations. We have Ohio State and Clemson most likely to reach the cfp at ~65% (because the ease of their championship games), followed by Alabama and Georgia at ~50% and 40% respectively. Same boring top 4. The challengers around the ~25% mark are Mississippi, TCU, and USC, and then 13 teams under 20%, including Syracuse at 14%. Could Syracuse make it? Sure – imagine this scenario:

  • Tennessee beats Alabama twice (week 7 and SEC championship
  • Tennessee, Florida, and Mississippi State beat Georgia (weeks 9, 10 & 11)
  • Texas Tech and Baylor beat TCU (weeks 10 & 12)
  • UCLA and Oregon beat USC (week 12 and Pac12 championship)

You could end up with undefeated Syracuse, Ohio State, and Tennessee coupled with winners of the Big12 and Pac12 at 2-3 losses each, and a 2-loss Alabama. In that (unlikely) scenario, you put in Tennessee, Ohio State, Alabama, and Syracuse. And variations of that are exactly what the computer came up with 140 times out of the 1,000 simulated seasons.

Enjoy the new tool, compare it with ESPNs probabilities through the season, and drop me a line at @CiscoNeville if you have any thoughts on this new visualization.

Elo predictions for college football – base and divisor

Ever thought about chess ratings? The highest chess rating ever for a human is held by Magnus Carlsen at 2882. The lowest is shared by many people at 100. The United States Chess Federation initially aimed for an average club player to have a rating of 1500. There is no theoretical highest or lowest possible Elo rating (the best computers are at ~3500 and the negative ratings are theoretically possible, but those people will get kicked from tournaments, so they arbitrarily set 100 as a lowest possible rating).

This particular range of numbers from 100 – 3500 is a consequence of the base and divisor that Arpad Elo chose. The Elo rating system for chess uses a base of 10 and a divisor of 400. Why? According to wikipedia the 400 was chosen because Elo wanted a 200 rating point difference to mean that the stronger player would win about 75% of the time, and people assume that he used 10 as a base because we live in a base 10 world. Interestingly if he would have used base 9 then 200 points would exactly be a 75% chance of win, where base 10 is more like 76% :

1 /(1+9(200/400)) = .25

1 /(1+10(200/400)) ≈ .2402

But enough on Chess. I like the playoffPredictor mathematical formula that puts the teams between roughly 0 and 1 instead of 100 and 3500. But what base and divisor do I use with that system?

Last year I went with base equal to the week number (1-17) and a divisor of .4. The reason for the week number is because bases 2-3-4 don’t exponent out to crazy scenarios, so in week 2 when there is very little data it does not make such drastic judgements. The divisor I picked empirically, it seemed to fit the data and it was also a callout to Elo’s 400.

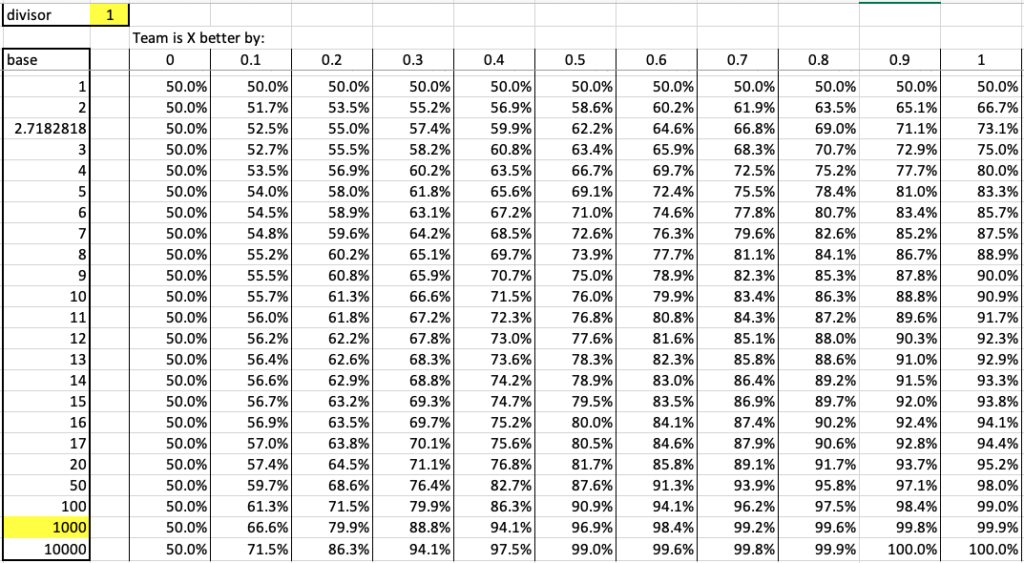
Really though I have been doing some fiddling and I think a base of 1000 and a divisor of 1 will work better. Here are some spreadsheet results.

Elo probabilities for different bases with constant divisor of 1

To read the above table, look at the row for 1000. This reads so if a team is better by .2 (like computer ratings of .9 and .7 for the 2 teams) then the .9 team as a 79.9% chance of winning. I need to model these against real life, but I feel this is a start.

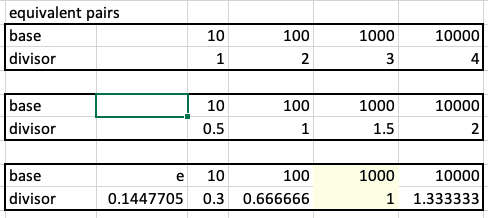
Further for choosing a base and divisor the following are all equivalent pairs:

equivalent pairs for bases/divisors

So 1000 and 1 give the same result as 10000 and 1.3333, or 100 and .6666. In the same way 1000 and 3 give the same result as 100 and 2, or 10 and 1. Log math.

So I’m going to move to a base of 1000 and a divisor of 1. The divisor of 1 make sense — take that out of the equation. Then, what base should you use? Empirically 1000 seems to fit well. I need to backtest with data from week 13-14 when ratings are pretty established to see how the percentages mesh with Vegas. To do.

At a base of 1000 and divisor of 1, a team with a rating +.16 more than an opponent will have a 75% chance of winning. So in this sense +.16 corresponds to 200 points in chess Elo.

In my rating the teams will be normally distributed with a mean at 0.5 and a standard deviation around 0.25. Meaning teams that are separated by 1 standard deviation, the better team has a 85% chance at success. For example, the following teams are all about 1 sigma apart:

  • #1 Georgia (~1)
  • #20 BYU (~.75)
  • #70 Illinois (~.5)
  • #108 Tulane (~.25)
  • #129 1AA (FCS) (~0)

So Georgia has a 85% chance of beating BYU, BYU has a 85% chance of beating Illinois, Illinois has an 85% chance of beating Tulane, and Tulane has a 85% chance of beating a FCS school. Is that right? Not sure

Keeping with the logic, Georgia would have a 97% chance of beating Illinois [1/(1+1000^(-.5))]. BYU would have a 97% chance of beating Tulane. Are those right? I think so. Would need to check against Vegas.

tldr; PlayoffPredictor.com used to use week number and .4 for the base and divisor, but now uses 1000 for the base and 1 for the divisor.

Final weekend – CFP chances

Heading into Saturday morning here are the playoff chances for each team:

Georgia – 100% – lock
Alabama – 83% – In with a victory vs Georgia, or any Michigan, Cincinnati, or OK State loss
Cincinnati – 70% – In with a win over Houston
Michigan – 65% – In with a win over Iowa
Oklahoma State – 51% – In with win over Baylor EXCEPT if Alabama, Michigan, Cincinnati all win, or in with Georgia, Michigan, and Cincy all lose.
Ohio State – 17% – In with Georgia & Michigan win, Cincy & OK State loss, OR Georgia win, Michigan & Cincy loss, OR Georgia & Cincy & OK State loss, OR Georgia, Michigan, Cincy and OK State all lose.
Baylor – 13% – In with: Baylor beats OK State, Iowa beats Michigan


College Football week 11 probabilities

I have been messing around with playoffpredictor.com. Still have a long way to go, but I thought I would look at the data for this weeks games and see how it compares to betting available at Draftkings money line. I am looking to exploit situations where the moneyline payout is misplaced compared to the predicted winning probabilities from playoffpredictor.com.

When the expected value on a moneyline bet is greater than 100%, I want to bet that game/team. In this weeks top 11 games, there are 6 games that the computer believes you can make a bet and get an expected payout in excess of 100% of the bet.

The most appealing, from the computer standpoint, is taking Purdue to beat Ohio State, with an expected payout of $2.89 on a $1.00 bet. This intuitively makes sense as Purdue is ranked #19 by the computer (and also #19 by the committee), and #19 beating #4, especially when played in #19 stadium, is very reasonably possible. Probable? no, but the payout at +750 is a huge incentive to bet on Purdue.

The least appealing bet by the computer is Penn State over Michigan, with an expected payout of 57 cents on a $1.00 bet.

Georgia vs Tennessee

Georgia (-1250)
Total return on $1 bet if bet is successful (Georgia wins) = $1 * 1350/1250 = $1.08
P(Georgia wins) = 91%
Expected return of $1 bet on Georgia = $1.08 * 91% = $0.98

Tennessee (+750)
Total return on $1 bet if Tennessee wins = $1 * 850/100 = $8.50
P(Tennessee wins) = 9%
Expected payoff of $1 bet on Tennessee = $8.50 * 9% = $0.765 

Georgia – Tennesse is what is expected — each bet is expected to have a negative return — the house wins both ways.

But sometimes the computer spots something it likes

New Mexico State vs Alabama

No moneyline offered on New Mexico State vs Alabama

Cincinnati vs South Florida

Cincinnati = $1.01
South Florida = $0.36

Michigan vs Penn State

moneyline odds (DraftKings)unbiased probabilities (playoffpredictor.com)Total expected return on $1
Georgia-12500.910.98
Tennessee+7500.090.77
Alabama0.98
New Mexico State0.02
Oregon-6300.780.90
Washington State+4500.221.21
Ohio State-12500.660.71
Purdue+7500.342.89
Cincinnati-22000.971.01
South Florida+11000.030.36
Michigan-1150.711.33
Penn State-1050.290.57

Oklahoma vs Baylor

Mississippi State vs Auburn

Northwestern vs Wisconsin

Utah vs Arizona

Purdue vs Ohio State

Minnesota vs Iowa

Southern Miss vs UTSA

Maryland vs Michigan State

Texas A&M vs Ole Miss

Notre Dame vs Virginia

NC State vs Wake Forest

Arkansas vs LSU

TCU vs Oklahoma State

Washington State vs Oregon

Nevada vs San Diego State

Results will be posted next week!

First cfp prediction of 2019 – Its Georgia, not Alabama

Today is a big day in the life of my college football playoff predictor site (playoffpredictor.com). Today is the second CFP committee ranking for the 2019 season, which means it is the first prediction week for the computer model.
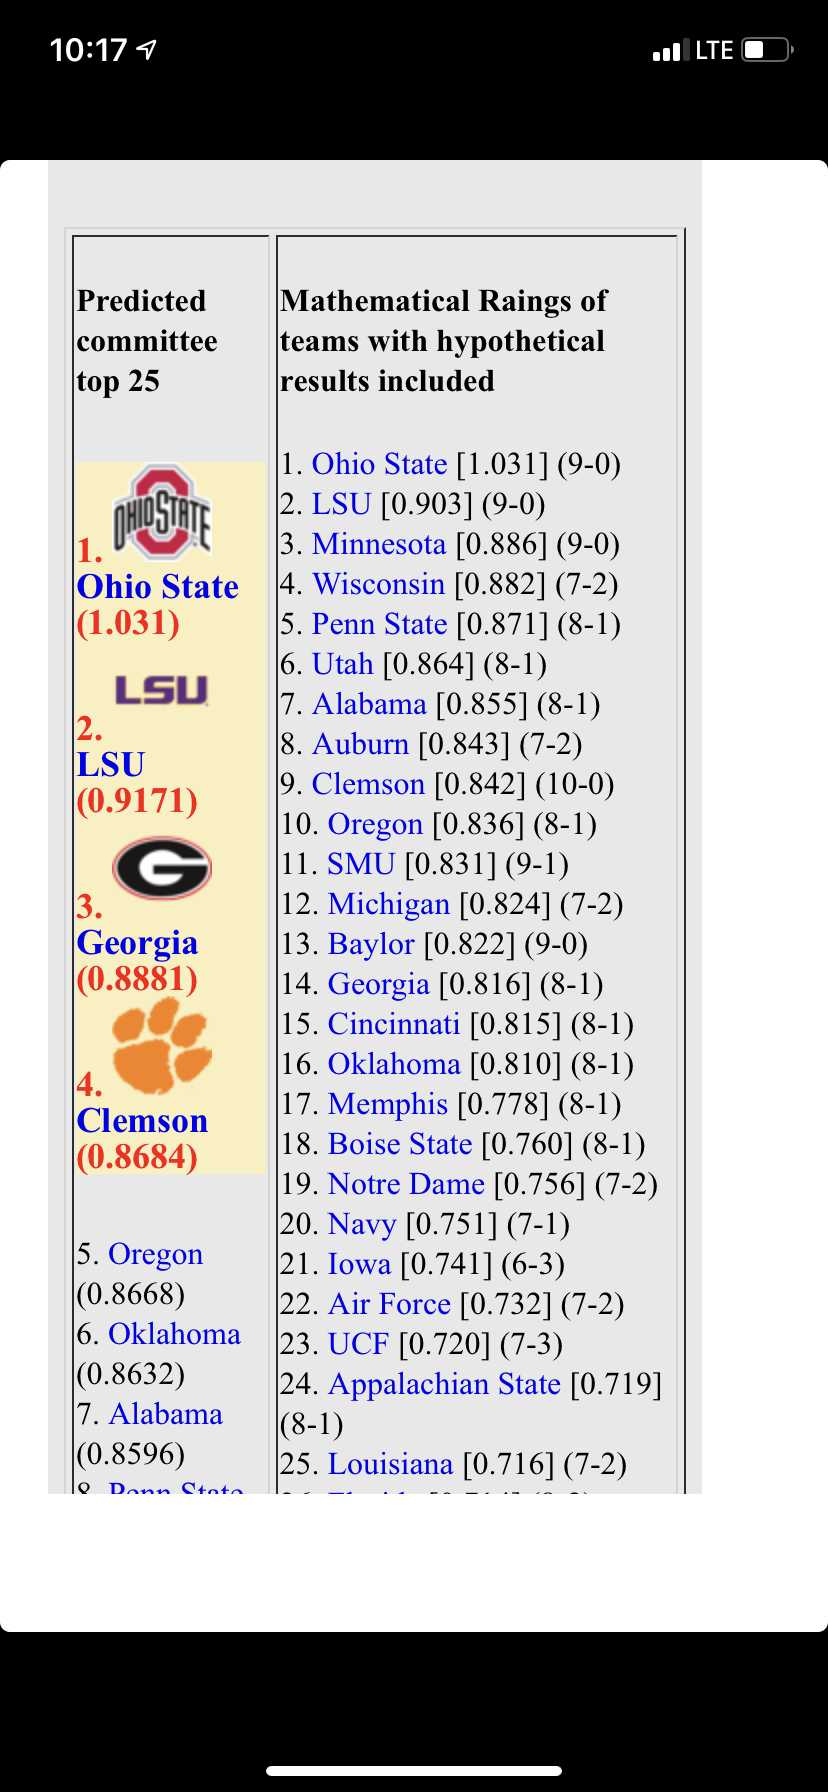
what is in store for tonight? According to the model we will have Ohio State, LSU, and Clemson in three of the four spots. No surprises there. One surprise that the playoffpredictor says that differs with the AP committee poll – Georgia, not Alabama is in the fourth slot.

Personally, I think they will put Oregon in that slot – I think they will consider a last-second lost to Auburn on a neutral field much superior to a loss to South Carolina on Georgia’s home field. The problem with the first Prediction of the season is that there is not much bias information, those biases tend to smooth out as the season goes on.

If I were a voting member of the committee I would advocate for exactly what the computer says, which is Minnesota and Wisconsin in spots three and four. No Clemson, no Alabama, no Georgia. Minnesota is obviously unbeaten, but I just don’t see the committee changing on a dime from Voting them 17 to voting them number three. I hope it happens, but I’m not holding my breath. As far as Wisconsin? Well they were destroyed by Ohio State, but Ohio State looks fantastic. Other than that just a one point loss to a decent Illinois team. That certainly just as good or better than anybody else’s one loss who has some quality wins to go along with it. Alabama has nothing in the terms of quality wins. Their best win is Texas A&M, followed by Tennessee, southern Mississippi, and Duke. Yes, Alabama’s second best win was to a team that also lost to an FCS level team this year at home. Ouch.

Stay tune for 7 PM tonight, when we see if the first prediction is 75% correct or 100% correct.


Habitually Over-rated! clap, clap, clap clap clap!

5 years of college football data are in the books and I have enough data now to look at the playoffPredictor biases and make some determinations about habitually overrated and underrated teams that the playoff committee loves or snubs.

A little primer if you need it — each week of the college football season the computer assigns a rating and ranking to each top 25 team. During weeks 9-15 the playoff committee also assigns each team a ranking. Each week we can compare the committee rankings to the computer rankings and make an objective determination about over-ranking or under-ranking.

Using final season average rating biases, here is what we have after 5 years.

Conclusion? The perennial over-ranked team are also the teams that most often make the college football playoff. 3 out of 5 years for Alabama, Clemson, Washington and Baylor. 4 out of 5 years for Oklahoma and Mississippi State.

Interestingly, Ohio State (the only team besides Alabama, Clemson and Oklahoma to make multiple playoff appearances) has zero seasons over-rated or under-rated by the committee.

But there you have it. Conculsive proof that the rich in college football get richer, not because they are better, but because us humans are biased to think of the bluebloods as better.